What are Network Administrator metrics? Crafting the perfect Network Administrator metrics can feel overwhelming, particularly when you're juggling daily responsibilities. That's why we've put together a collection of examples to spark your inspiration.
Copy these examples into your preferred app, or you can also use Tability to keep yourself accountable.
Find Network Administrator metrics with AI While we have some examples available, it's likely that you'll have specific scenarios that aren't covered here. You can use our free AI metrics generator below to generate your own strategies.
Examples of Network Administrator metrics and KPIs 1. Network Uptime Percentage of time the network is operational during a specific period
What good looks like for this metric: 99.99%
Ideas to improve this metric Implement redundancy systems Regularly monitor network performance Conduct routine maintenance Use reliable hardware components Train staff for quick issue resolution 2. Server Response Time Average time taken for a server to respond to a request
What good looks like for this metric: <200ms
Ideas to improve this metric Optimise server configuration Use content delivery networks Implement load balancing Upgrade server hardware Reduce server load through caching 3. Energy Efficiency Amount of energy used by the infrastructure relative to its output
What good looks like for this metric: PUE of 1.2
Ideas to improve this metric Upgrade to energy-efficient hardware Implement effective cooling systems Regularly audit energy usage Utilise renewable energy sources Implement power-saving protocols 4. Incident Rate Number of incidents occurring in infrastructure per given time period
What good looks like for this metric: <5 incidents per month
Ideas to improve this metric Conduct regular infrastructure audits Train staff on incident management Improve monitoring systems Implement preventive maintenance Investigate and resolve root causes promptly 5. Cost Efficiency Total cost of infrastructure operations in relation to its performance
What good looks like for this metric: $0.10 per user per hour
Ideas to improve this metric Optimise resource allocation Negotiate better vendor contracts Implement cost-tracking systems Automate routine tasks Regularly review operational budgets
← →
1. Migration Time Time taken to migrate network infrastructure and services to the isolated network environment
What good looks like for this metric: Less than or equal to 1 day
Ideas to improve this metric Streamline migration processes Use automation tools to reduce manual work Conduct trial runs to identify potential issues Provide adequate training to the migration team Develop clear migration documentation 2. Platform Services in Isolated Network Percentage of platform services successfully transferred to an isolated network environment
What good looks like for this metric: 100% of services
Ideas to improve this metric Create a detailed list of all platform services Use project management tools for tracking migration progress Allocate dedicated resources for network transition tasks Regular audit and feedback sessions Implement a tracking dashboard for stakeholders 3. Domain Services Migration Number of domain-specific services migrated to the isolated network
What good looks like for this metric: At least 2 services
Ideas to improve this metric Identify domain services with highest value impact Establish priorities based on current dependencies Develop an incremental migration plan Test services in the isolated environment iteratively Foster collaboration between domain and platform teams 4. Observability Noise Reduction Rate of noise reduction and signal improvement in observability tools
What good looks like for this metric: Annually decreased noise with improved signals
Ideas to improve this metric Adopt AI-based noise reduction solutions Regularly review and update monitoring configurations Implement automated alert tuning mechanisms Conduct team workshops on effective data interpretation Focus on continuous learning from alert incidents 5. Disaster Recovery Time Total time required to complete the disaster recovery process
What good looks like for this metric: Complete within 2 days
Ideas to improve this metric Increase automation in backup/recovery processes Develop efficient recovery scripts and workflows Invest in better infrastructure for faster processing Establish regular disaster recovery drills Monitor and optimise AWS usage to reduce limitations
← →
Tracking your Network Administrator metrics Having a plan is one thing, sticking to it is another.
Don't fall into the set-and-forget trap. It is important to adopt a weekly check-in process to keep your strategy agile – otherwise this is nothing more than a reporting exercise.
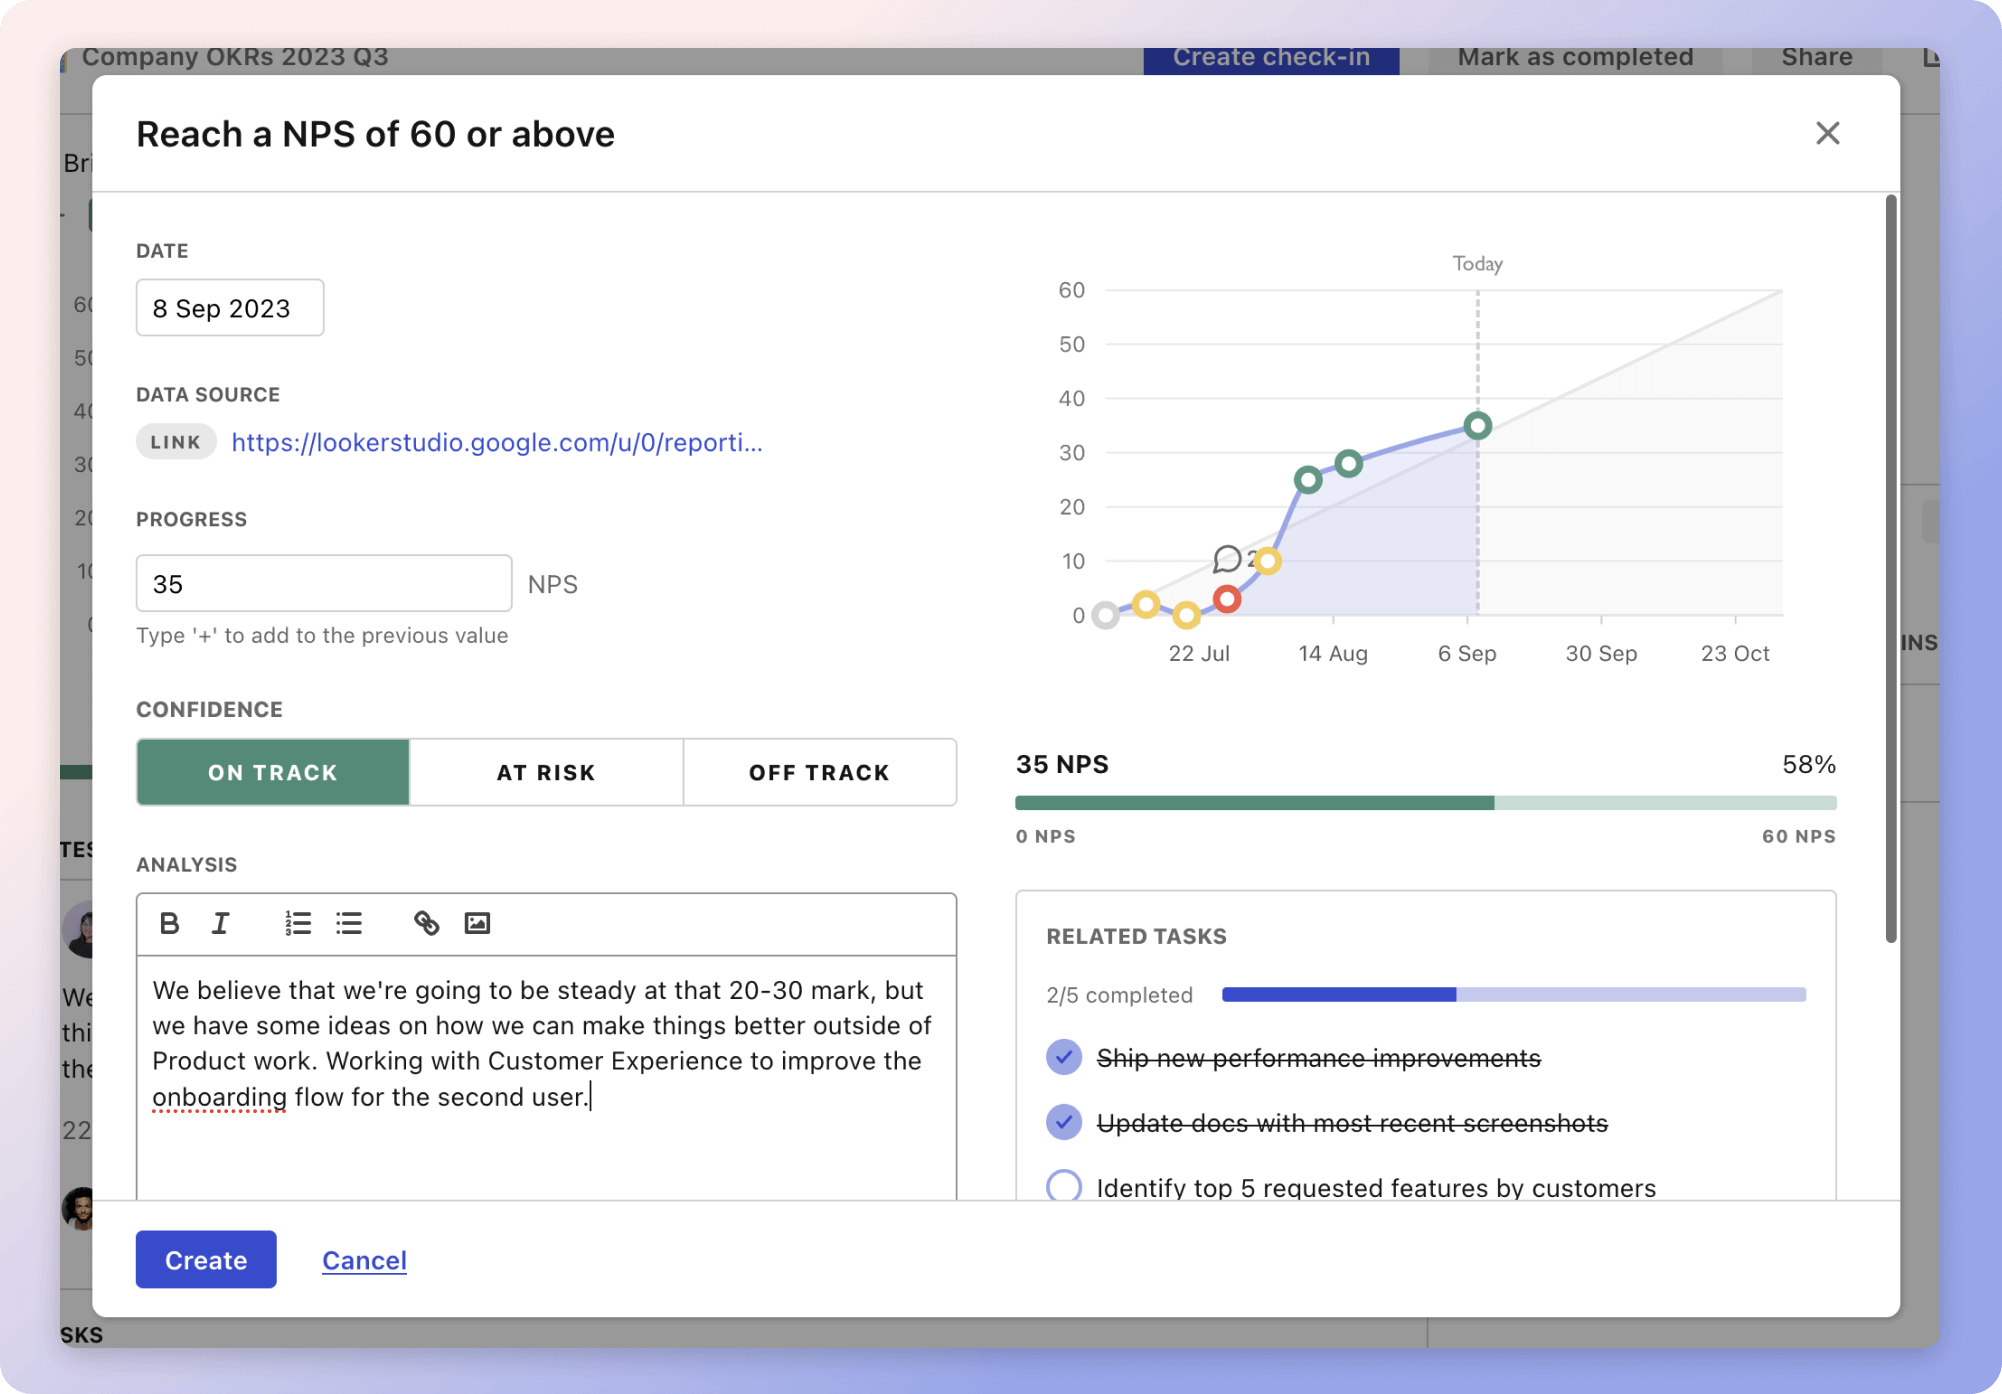
A tool like Tability can also help you by combining AI and goal-setting to keep you on track.
More metrics recently published We have more examples to help you below.
Planning resources OKRs are a great way to translate strategies into measurable goals. Here are a list of resources to help you adopt the OKR framework:
 Tability's check-ins will save you hours and increase transparency
The best metrics for L2 Support Team Development
The best metrics for Vendor Compliance Standards
The best metrics for Improving vendor cleanliness
The best metrics for Sanitation Procedure Compliance
The best metrics for Academic and Career Progress
The best metrics for Quality Assurance Team Effectiveness