What are Server Response Time metrics?
Crafting the perfect Server Response Time metrics can feel overwhelming, particularly when you're juggling daily responsibilities. That's why we've put together a collection of examples to spark your inspiration.
Copy these examples into your preferred app, or you can also use Tability to keep yourself accountable.
Find Server Response Time metrics with AI
While we have some examples available, it's likely that you'll have specific scenarios that aren't covered here. You can use our free AI metrics generator below to generate your own strategies.
Examples of Server Response Time metrics and KPIs
Metrics for Infrastructure Performance
Tracking your Server Response Time metrics
Having a plan is one thing, sticking to it is another.
Don't fall into the set-and-forget trap. It is important to adopt a weekly check-in process to keep your strategy agile – otherwise this is nothing more than a reporting exercise.
A tool like Tability can also help you by combining AI and goal-setting to keep you on track.
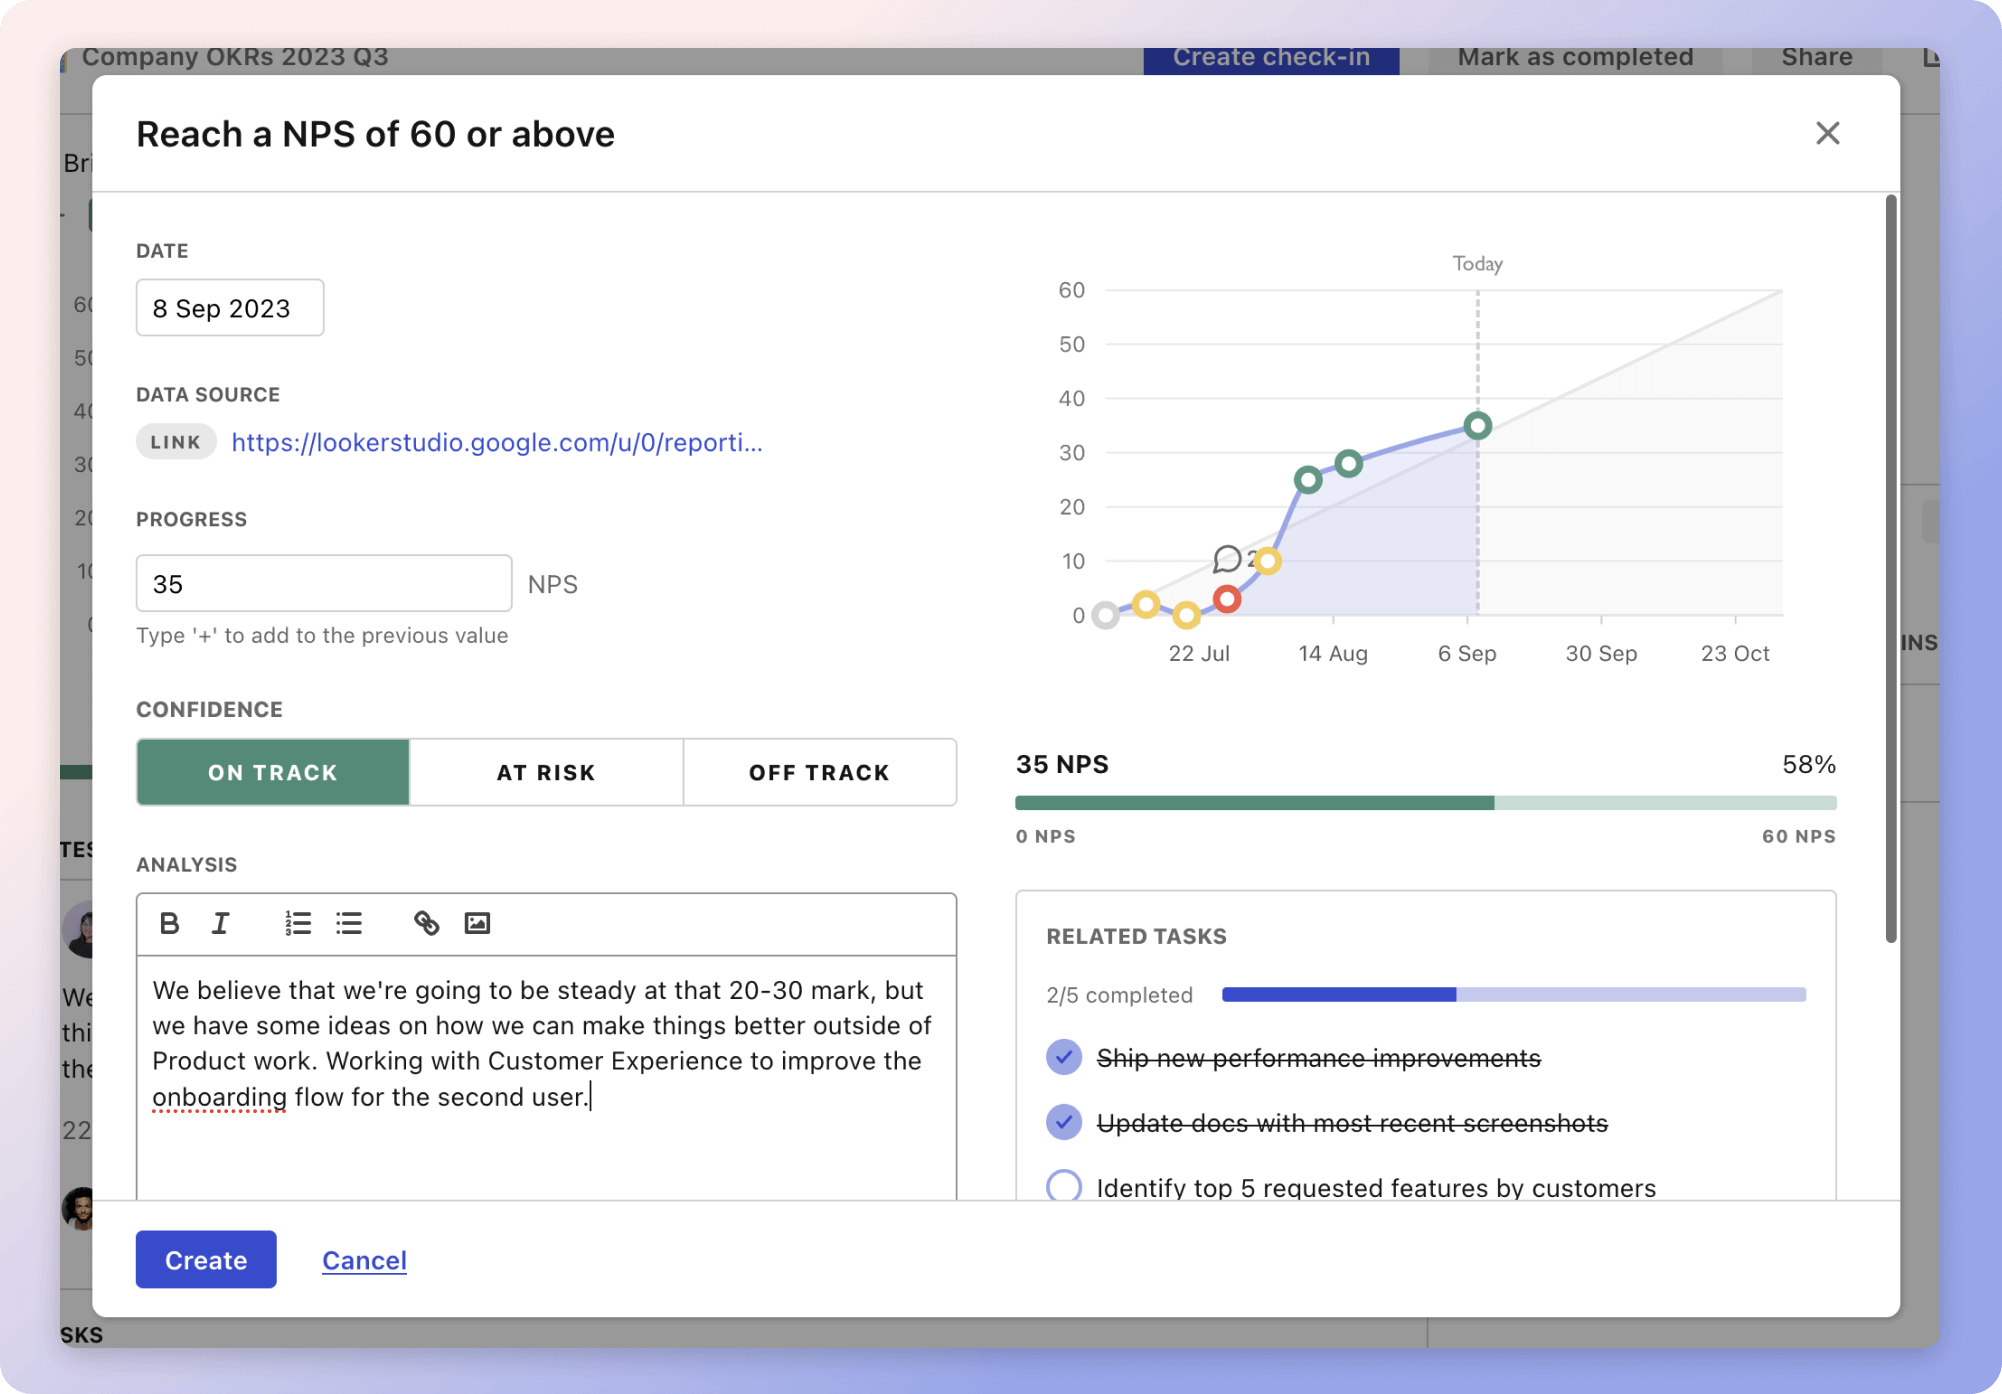
 Tability's check-ins will save you hours and increase transparency
More metrics recently published
We have more examples to help you below.
The best metrics for Increase Calls Through Google My Business
The best metrics for GRC MSSP Compliance
The best metrics for Reduce Courier Costs
The best metrics for Reducing Courier Costs
The best metrics for Operations Management Success
The best metrics for Ensuring sticker quality
Planning resources
OKRs are a great way to translate strategies into measurable goals. Here are a list of resources to help you adopt the OKR framework:
- To learn: What are OKRs? The complete 2024 guide
- Blog posts: ODT Blog
- Success metrics: KPIs examples