What are Deployment Frequency metrics? Crafting the perfect Deployment Frequency metrics can feel overwhelming, particularly when you're juggling daily responsibilities. That's why we've put together a collection of examples to spark your inspiration.
Copy these examples into your preferred app, or you can also use Tability to keep yourself accountable.
Find Deployment Frequency metrics with AI While we have some examples available, it's likely that you'll have specific scenarios that aren't covered here. You can use our free AI metrics generator below to generate your own strategies.
Examples of Deployment Frequency metrics and KPIs 1. Code Quality Measures the standards of the code written by the developer using metrics like cyclomatic complexity, code churn, and code maintainability index
What good looks like for this metric: Maintainability index above 70
Ideas to improve this metric Conduct regular code reviews Utilise static code analysis tools Adopt coding standards and guidelines Refactor code regularly to reduce complexity Invest in continuous learning and training 2. Deployment Frequency Evaluates the frequency at which a developer releases code changes to production
What good looks like for this metric: Multiple releases per week
Ideas to improve this metric Automate deployment processes Use continuous integration and delivery pipelines Schedule regular release sessions Encourage modular code development Enhance collaboration with DevOps teams 3. Lead Time for Changes Measures the time taken from code commit to deployment in production, reflecting efficiency in development and delivery
What good looks like for this metric: Less than one day
Ideas to improve this metric Streamline the code review process Optimise testing procedures Improve communication across teams Automate build and testing workflows Implement parallel development tracks 4. Change Failure Rate Represents the proportion of deployments that result in a failure requiring a rollback or hotfix
What good looks like for this metric: Less than 15%
Ideas to improve this metric Implement thorough testing before deployment Decrease batch size of code changes Conduct post-implementation reviews Improve error monitoring and logging Enhance rollback procedures 5. System Downtime Assesses the total time that applications are non-operational due to code changes or failures attributed to backend systems
What good looks like for this metric: Less than 0.1% downtime
Ideas to improve this metric Invest in high availability infrastructure Enhance real-time monitoring systems Regularly test system resilience Implement effective incident response plans Improve software redundancy mechanisms
← →
1. Code Quality Measures the frequency and severity of bugs detected in the codebase.
What good looks like for this metric: Less than 10 bugs per 1000 lines of code
Ideas to improve this metric Implement regular code reviews Use static code analysis tools Provide training on best coding practices Encourage test-driven development Adopt a peer programming strategy 2. Deployment Frequency Tracks how often code changes are successfully deployed to production.
What good looks like for this metric: Deploy at least once a day
Ideas to improve this metric Automate the deployment pipeline Reduce bottlenecks in the process Regularly publish small, manageable changes Incentivise swift yet comprehensive testing Improve team communication and collaboration 3. Mean Time to Recovery (MTTR) Measures the average time taken to recover from a service failure.
What good looks like for this metric: Less than 1 hour
Ideas to improve this metric Develop a robust incident response plan Streamline rollback and recovery processes Use monitoring tools to detect issues early Conduct post-mortems and learn from failures Enhance system redundancy and fault tolerance 4. Test Coverage Represents the percentage of code which is tested by automated tests.
What good looks like for this metric: 70% to 90%
Ideas to improve this metric Implement continuous integration with testing Educate developers on writing effective tests Regularly update and refactor out-of-date tests Encourage a culture of writing tests Utilise behaviour-driven development techniques 5. API Response Time Measures the time taken for an API to respond to a request.
What good looks like for this metric: Less than 200ms
Ideas to improve this metric Optimize database queries Utilise caching effectively Reduce payload size Use load balancing techniques Profile and identify performance bottlenecks
← →
Tracking your Deployment Frequency metrics Having a plan is one thing, sticking to it is another.
Don't fall into the set-and-forget trap. It is important to adopt a weekly check-in process to keep your strategy agile – otherwise this is nothing more than a reporting exercise.
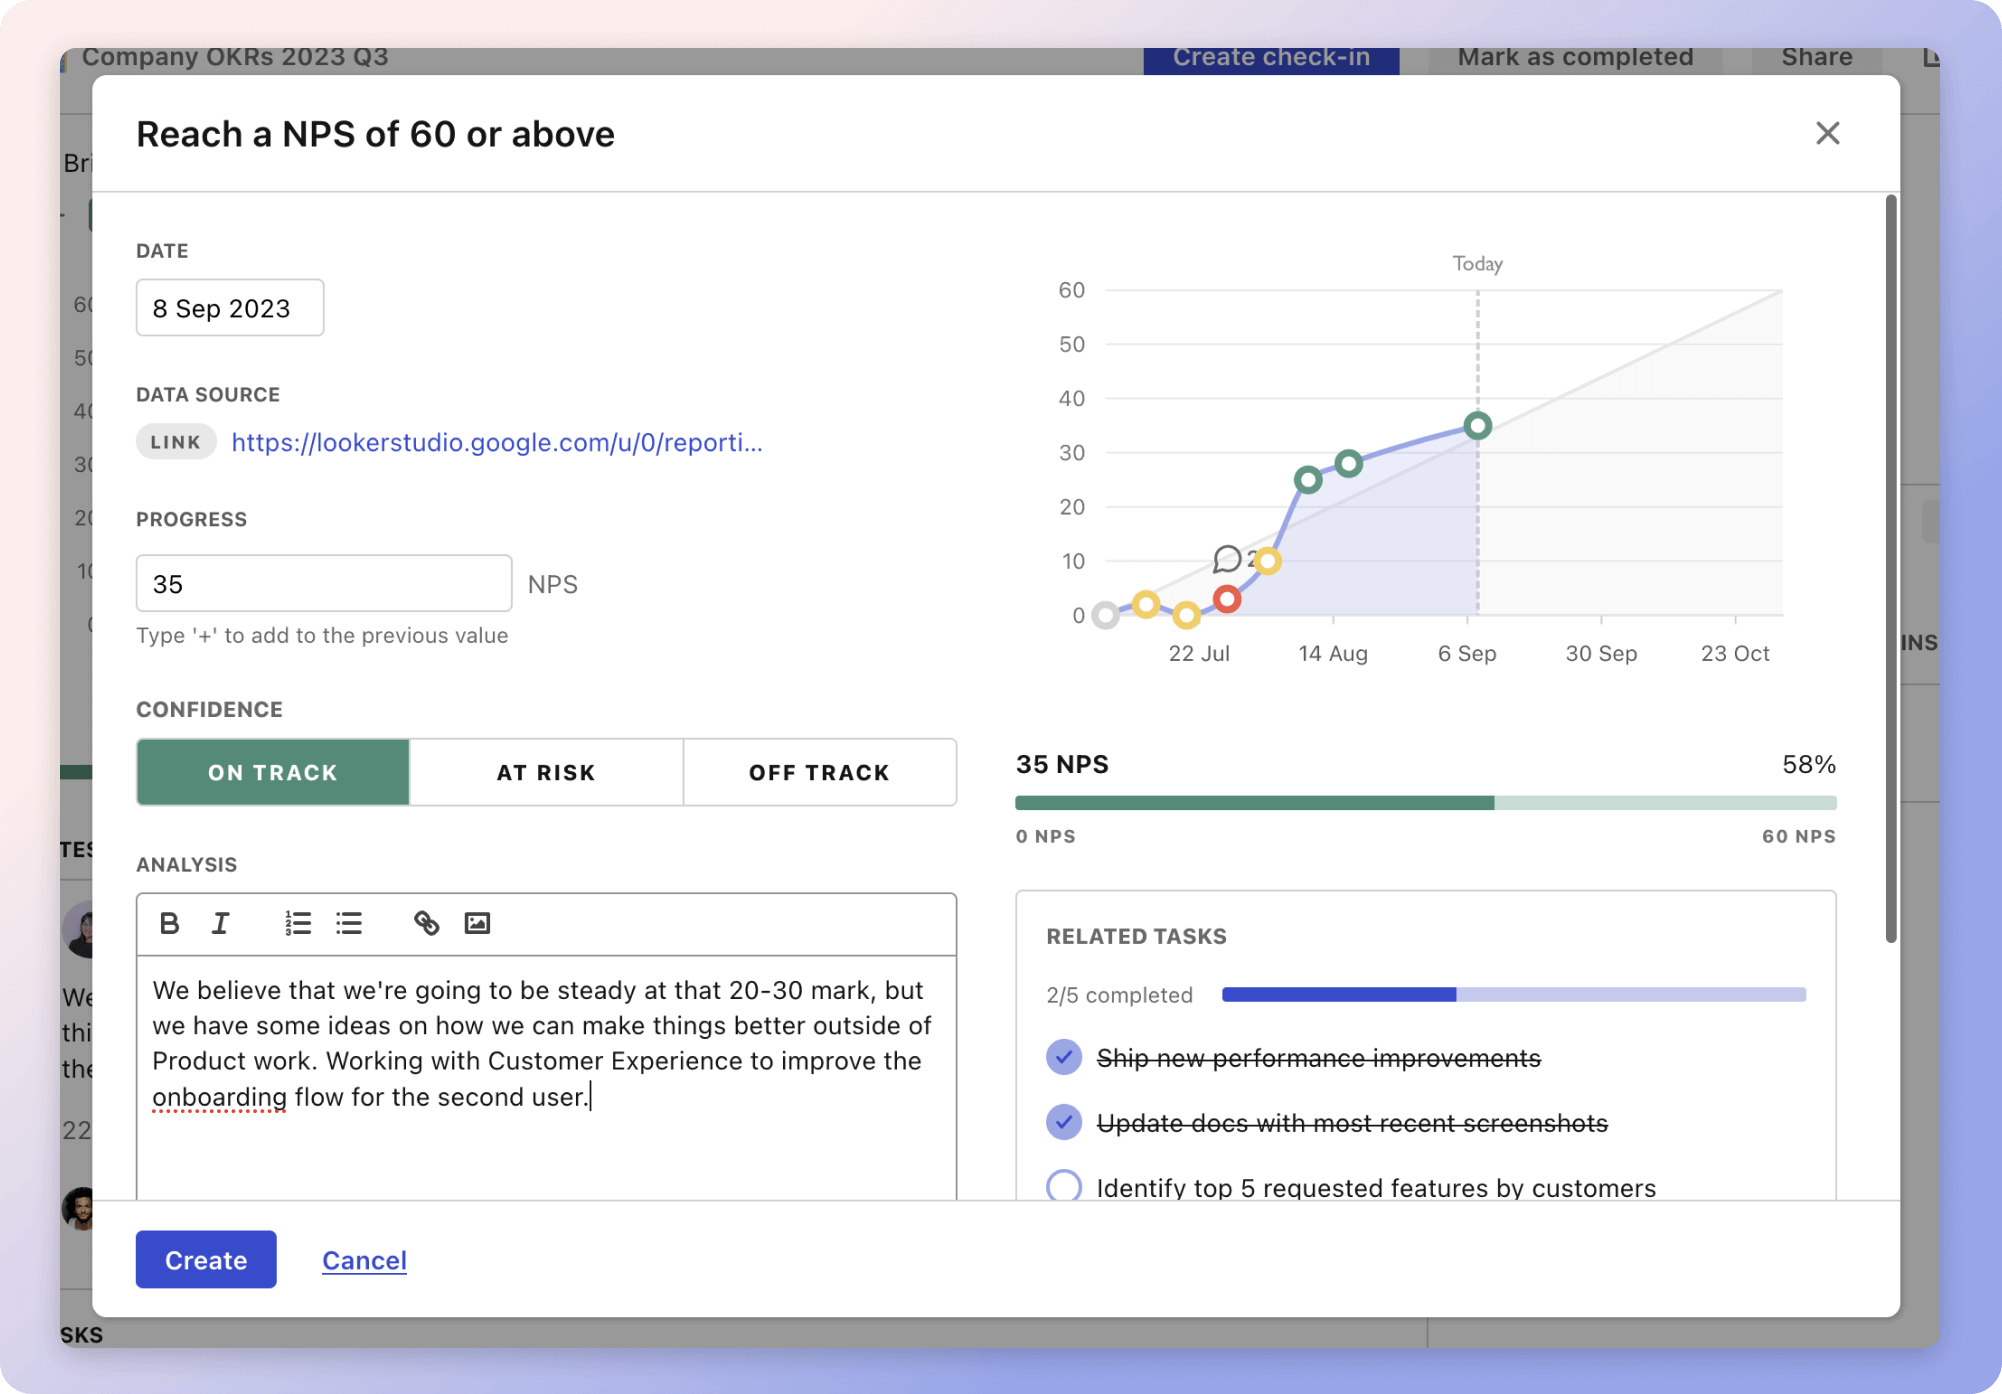
A tool like Tability can also help you by combining AI and goal-setting to keep you on track.
More metrics recently published We have more examples to help you below.
Planning resources OKRs are a great way to translate strategies into measurable goals. Here are a list of resources to help you adopt the OKR framework:
 Tability's check-ins will save you hours and increase transparency
The best metrics for Increase Calls Through Google My Business
The best metrics for GRC MSSP Compliance
The best metrics for Reduce Courier Costs
The best metrics for Reducing Courier Costs
The best metrics for Operations Management Success
The best metrics for Ensuring sticker quality