The objective of optimizing backend developer performance hinges on identifying key metrics that provide actionable insights. Focusing on code quality, deployment frequency, mean time to recovery, test coverage, and API response time ensures a robust development process. For example, maintaining high test coverage can prevent bugs, while enhancing deployment frequency promotes agility. Additionally, optimizing API response time improves user satisfaction by reducing latency.
These metrics matter as they guide backend teams toward continuous improvement. By implementing strategies like code reviews and automated deployment, teams can efficiently tackle issues, enhancing overall project quality. Moreover, benchmarks provide clear targets, like achieving less than 10 bugs per 1000 lines of code, motivating developers to adopt best practices in coding and testing.
Top 5 metrics for Backend Developer Performance
1. Code Quality
Measures the frequency and severity of bugs detected in the codebase.
What good looks like for this metric: Less than 10 bugs per 1000 lines of code
How to improve this metric:- Implement regular code reviews
- Use static code analysis tools
- Provide training on best coding practices
- Encourage test-driven development
- Adopt a peer programming strategy
2. Deployment Frequency
Tracks how often code changes are successfully deployed to production.
What good looks like for this metric: Deploy at least once a day
How to improve this metric:- Automate the deployment pipeline
- Reduce bottlenecks in the process
- Regularly publish small, manageable changes
- Incentivise swift yet comprehensive testing
- Improve team communication and collaboration
3. Mean Time to Recovery (MTTR)
Measures the average time taken to recover from a service failure.
What good looks like for this metric: Less than 1 hour
How to improve this metric:- Develop a robust incident response plan
- Streamline rollback and recovery processes
- Use monitoring tools to detect issues early
- Conduct post-mortems and learn from failures
- Enhance system redundancy and fault tolerance
4. Test Coverage
Represents the percentage of code which is tested by automated tests.
What good looks like for this metric: 70% to 90%
How to improve this metric:- Implement continuous integration with testing
- Educate developers on writing effective tests
- Regularly update and refactor out-of-date tests
- Encourage a culture of writing tests
- Utilise behaviour-driven development techniques
5. API Response Time
Measures the time taken for an API to respond to a request.
What good looks like for this metric: Less than 200ms
How to improve this metric:- Optimize database queries
- Utilise caching effectively
- Reduce payload size
- Use load balancing techniques
- Profile and identify performance bottlenecks
How to track Backend Developer Performance metrics
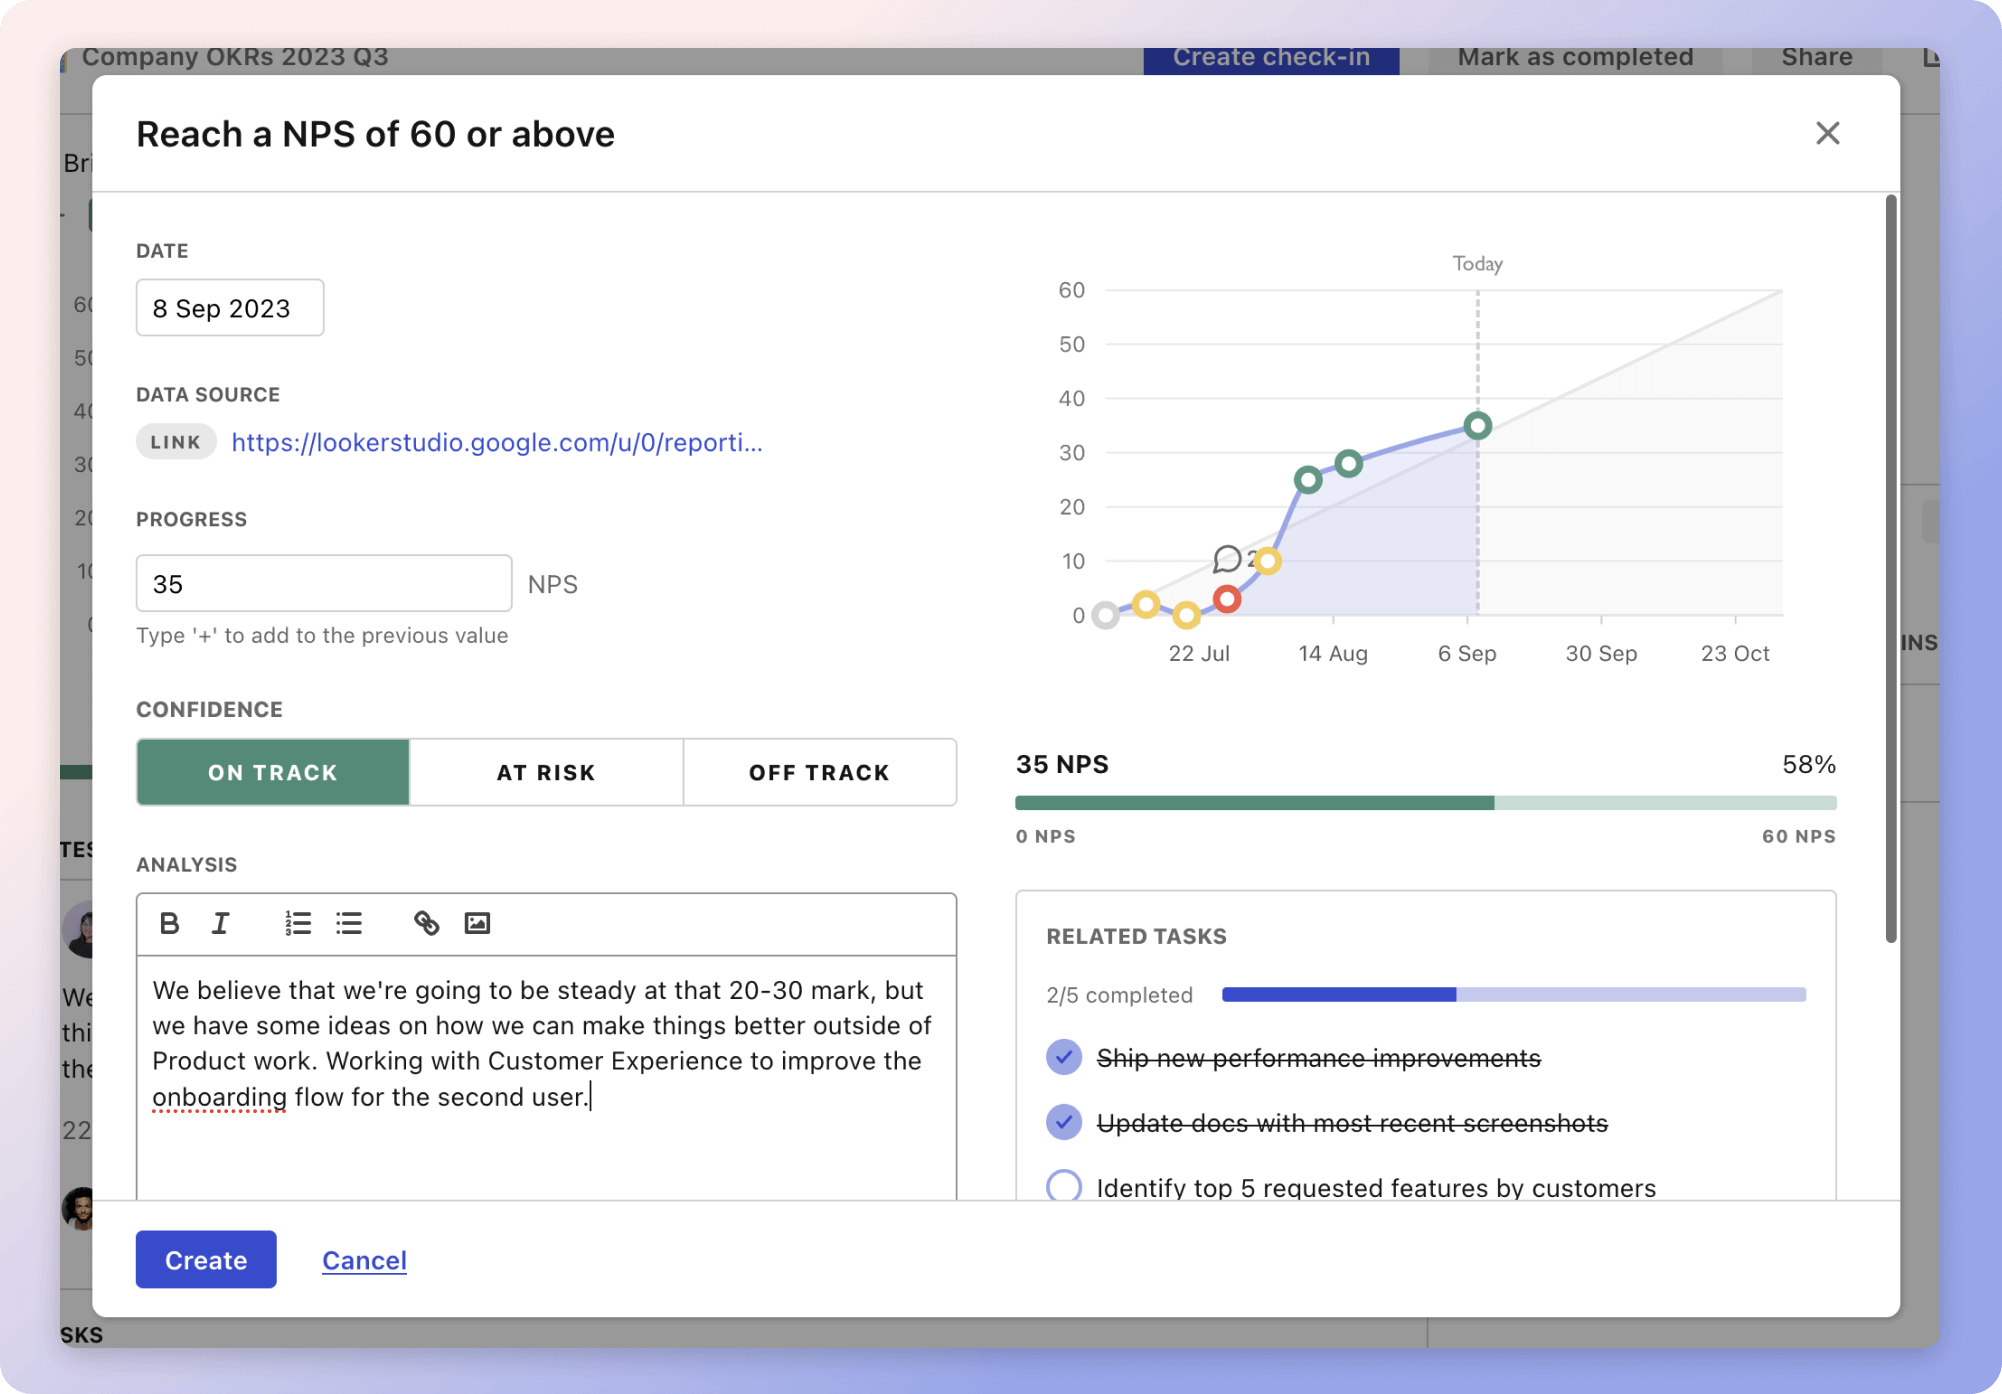
It's one thing to have a plan, it's another to stick to it. We hope that the examples above will help you get started with your own strategy, but we also know that it's easy to get lost in the day-to-day effort.
That's why we built Tability: to help you track your progress, keep your team aligned, and make sure you're always moving in the right direction.

Give it a try and see how it can help you bring accountability to your metrics.