OKR template to analyze investment performance across different regions
Your OKR template
The objective is to achieve this analysis within a 100% benchmark. The initiatives geared towards achieving this include comparing performance by region, data collection on respective investment performances, and finalizing a detailed performance report. These steps will help complete the overall analysis.
Another part of the objective targets the identification of the top 5 performing and under-performing regions by next month. Achieving this will entail gathering and analyzing sales data from all regions. Preparing a detailed comparative report, which will effectively rank regions based on their performance, will further ascertain this.
The final aspect of this OKR involves evaluation of ten distinct factors that may impact the performance in each region. This objective seeks to identify, analyze and compile these specific factors into a comprehensive report, providing insight into the influences that dictate regional performance.
ObjectiveAnalyze investment performance across different regions
KRDeliver a detailed investment performance report comparing all regions
Analyze and compare investment performance by region
Compile and format the detailed performance report
Collect data on investment performance for all regions
KRIdentify top 5 performing and under-performing regions by next month
Gather sales data from all regions
Analyze and rank regions based on performance
Prepare detailed comparative report
KREvaluate 10 distinct factors that influence the performance in each region
Identify 10 potential factors affecting regional performance
Analyze each factor's impact on the specific region
Compile findings into a comprehensive report
How to edit and track OKRs with Tability
You'll probably want to edit the examples in this post, and Tability is the perfect tool for it.
Tability is an AI-powered platform that helps teams set better goals, monitor execution, and get help to achieve their objectives faster.
With Tability you can:
- Use AI to draft a complete set of OKRs in seconds
- Connect your OKRs and team goals to your project
- Automate reporting with integrations and built-in dashboard
Instead of having to copy the content of the OKR examples in a doc or spreadsheet, you can use Tability’s magic importer to start using any of the examples in this page.
The import process can be done in seconds, allowing you to edit OKRs directly in a platform that knows how to manage and track goals.
Step 1. Sign up for a free Tability account
Go tohttps://tability.app/signup and create your account (it's free!)
Step 2. Create a plan
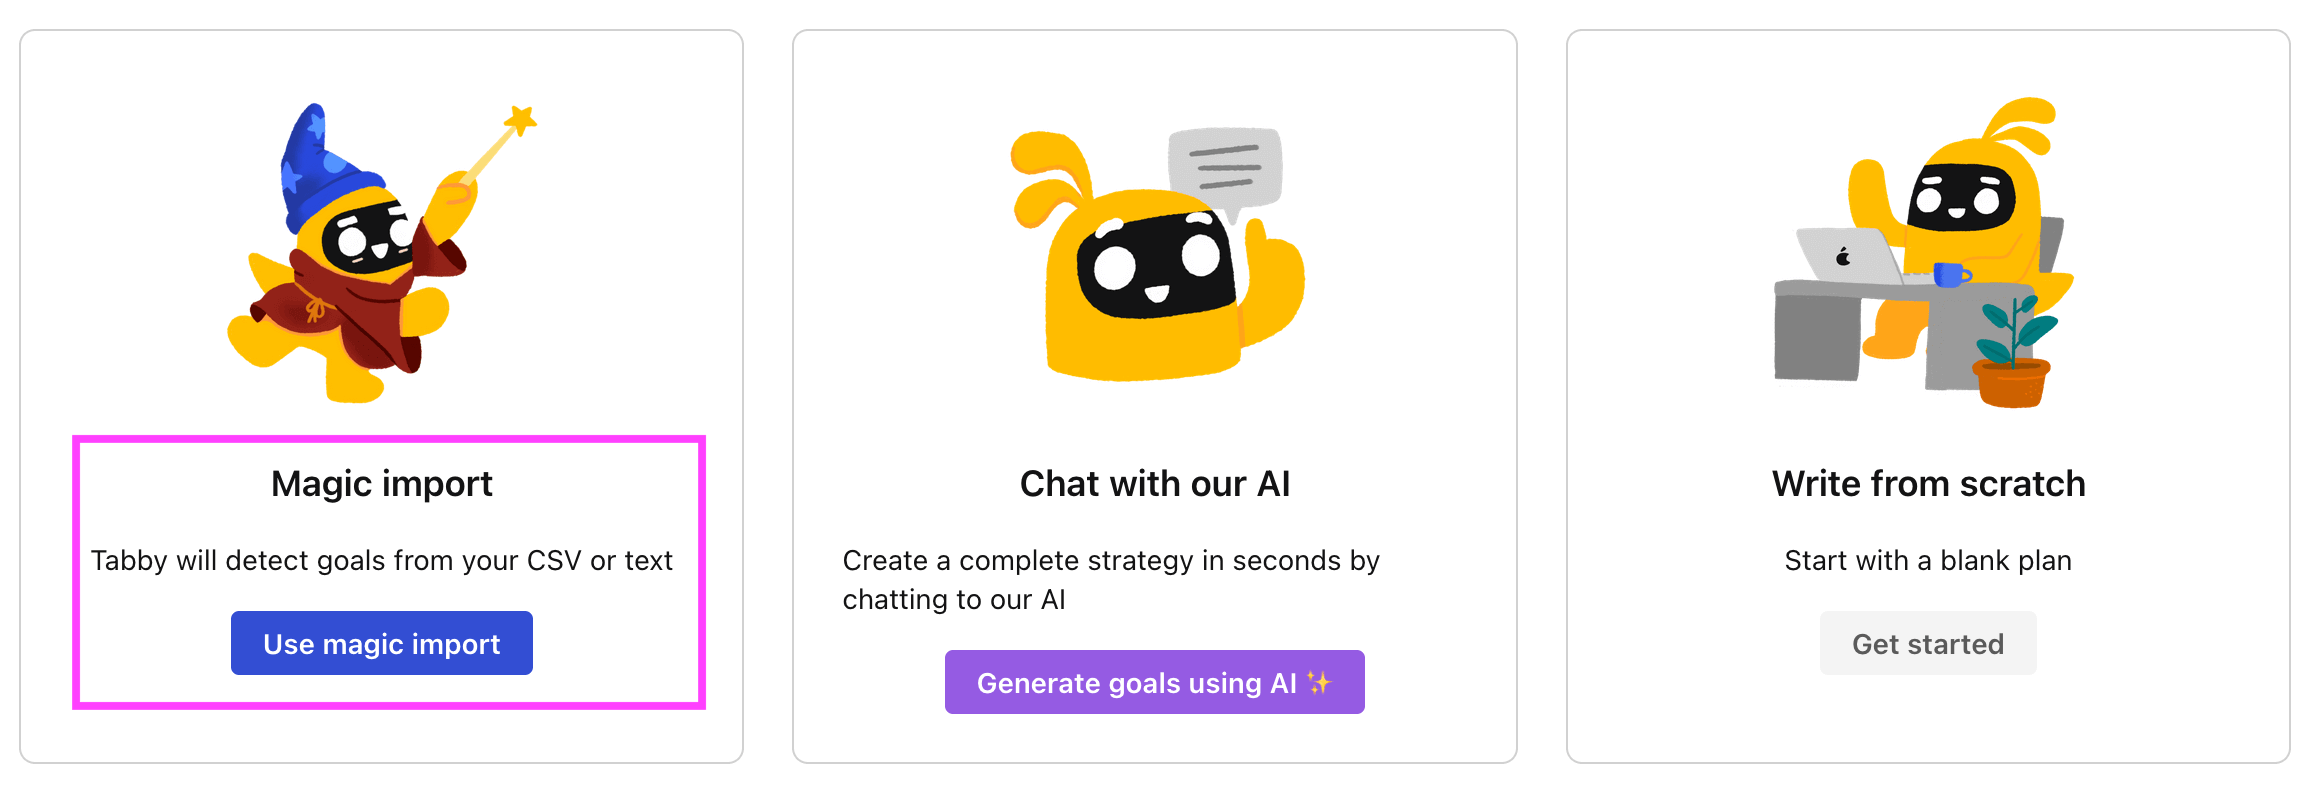
Follow the steps after your onboarding to create your first plan, you should get to a page that looks like the picture below.

Step 3. Use the magic importer
Click on Use magic import to open up the Magic Import modal.
Now, go back to the OKR examples, and click on Copy on the example that you’d like to use.

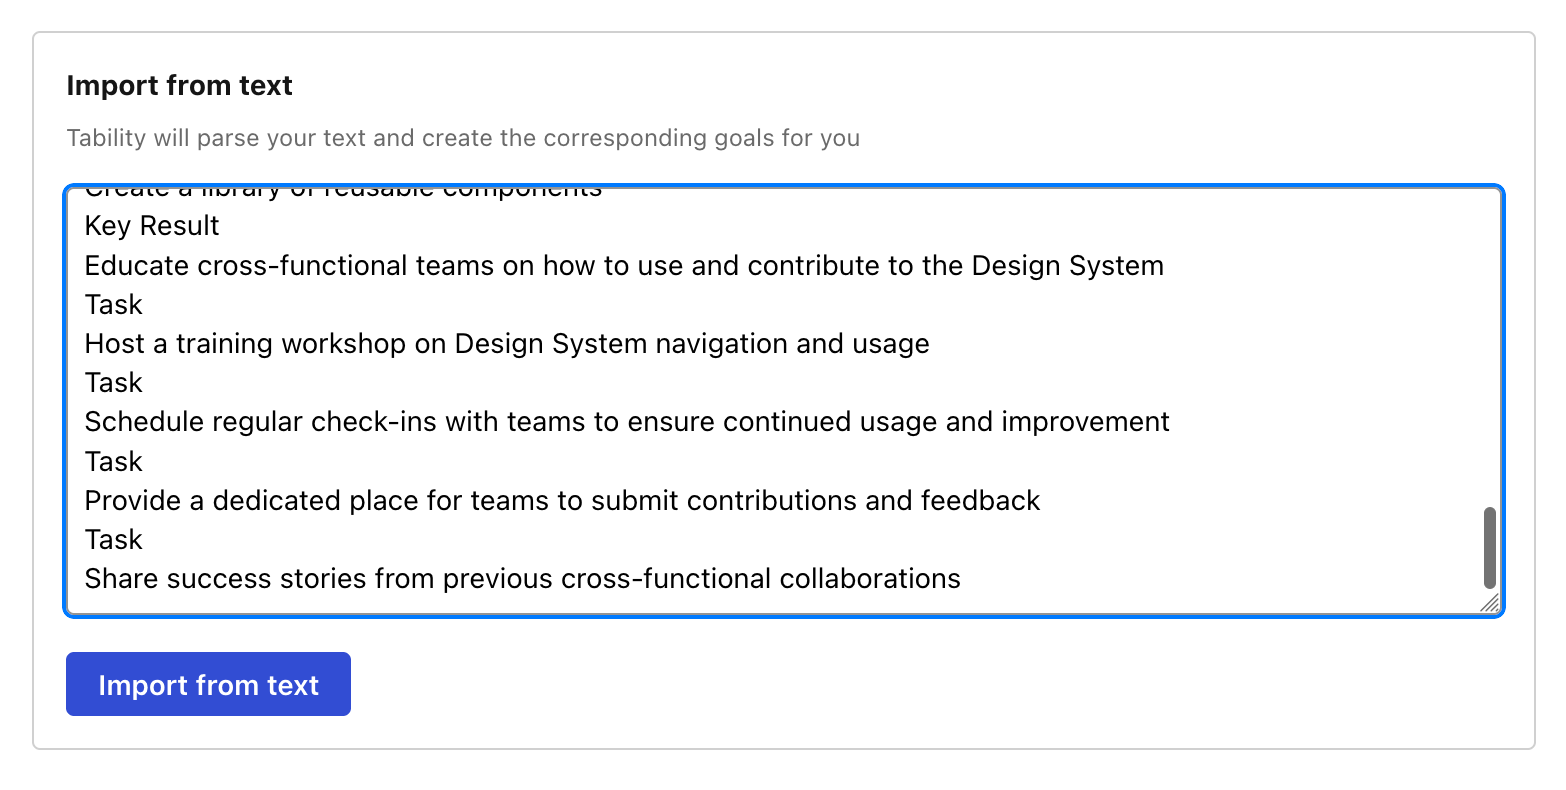
Paste the content in the text import section. Don’t worry about the formatting, Tability’s AI will be able to parse it!

Now, just click on Import from text and let the magic happen.

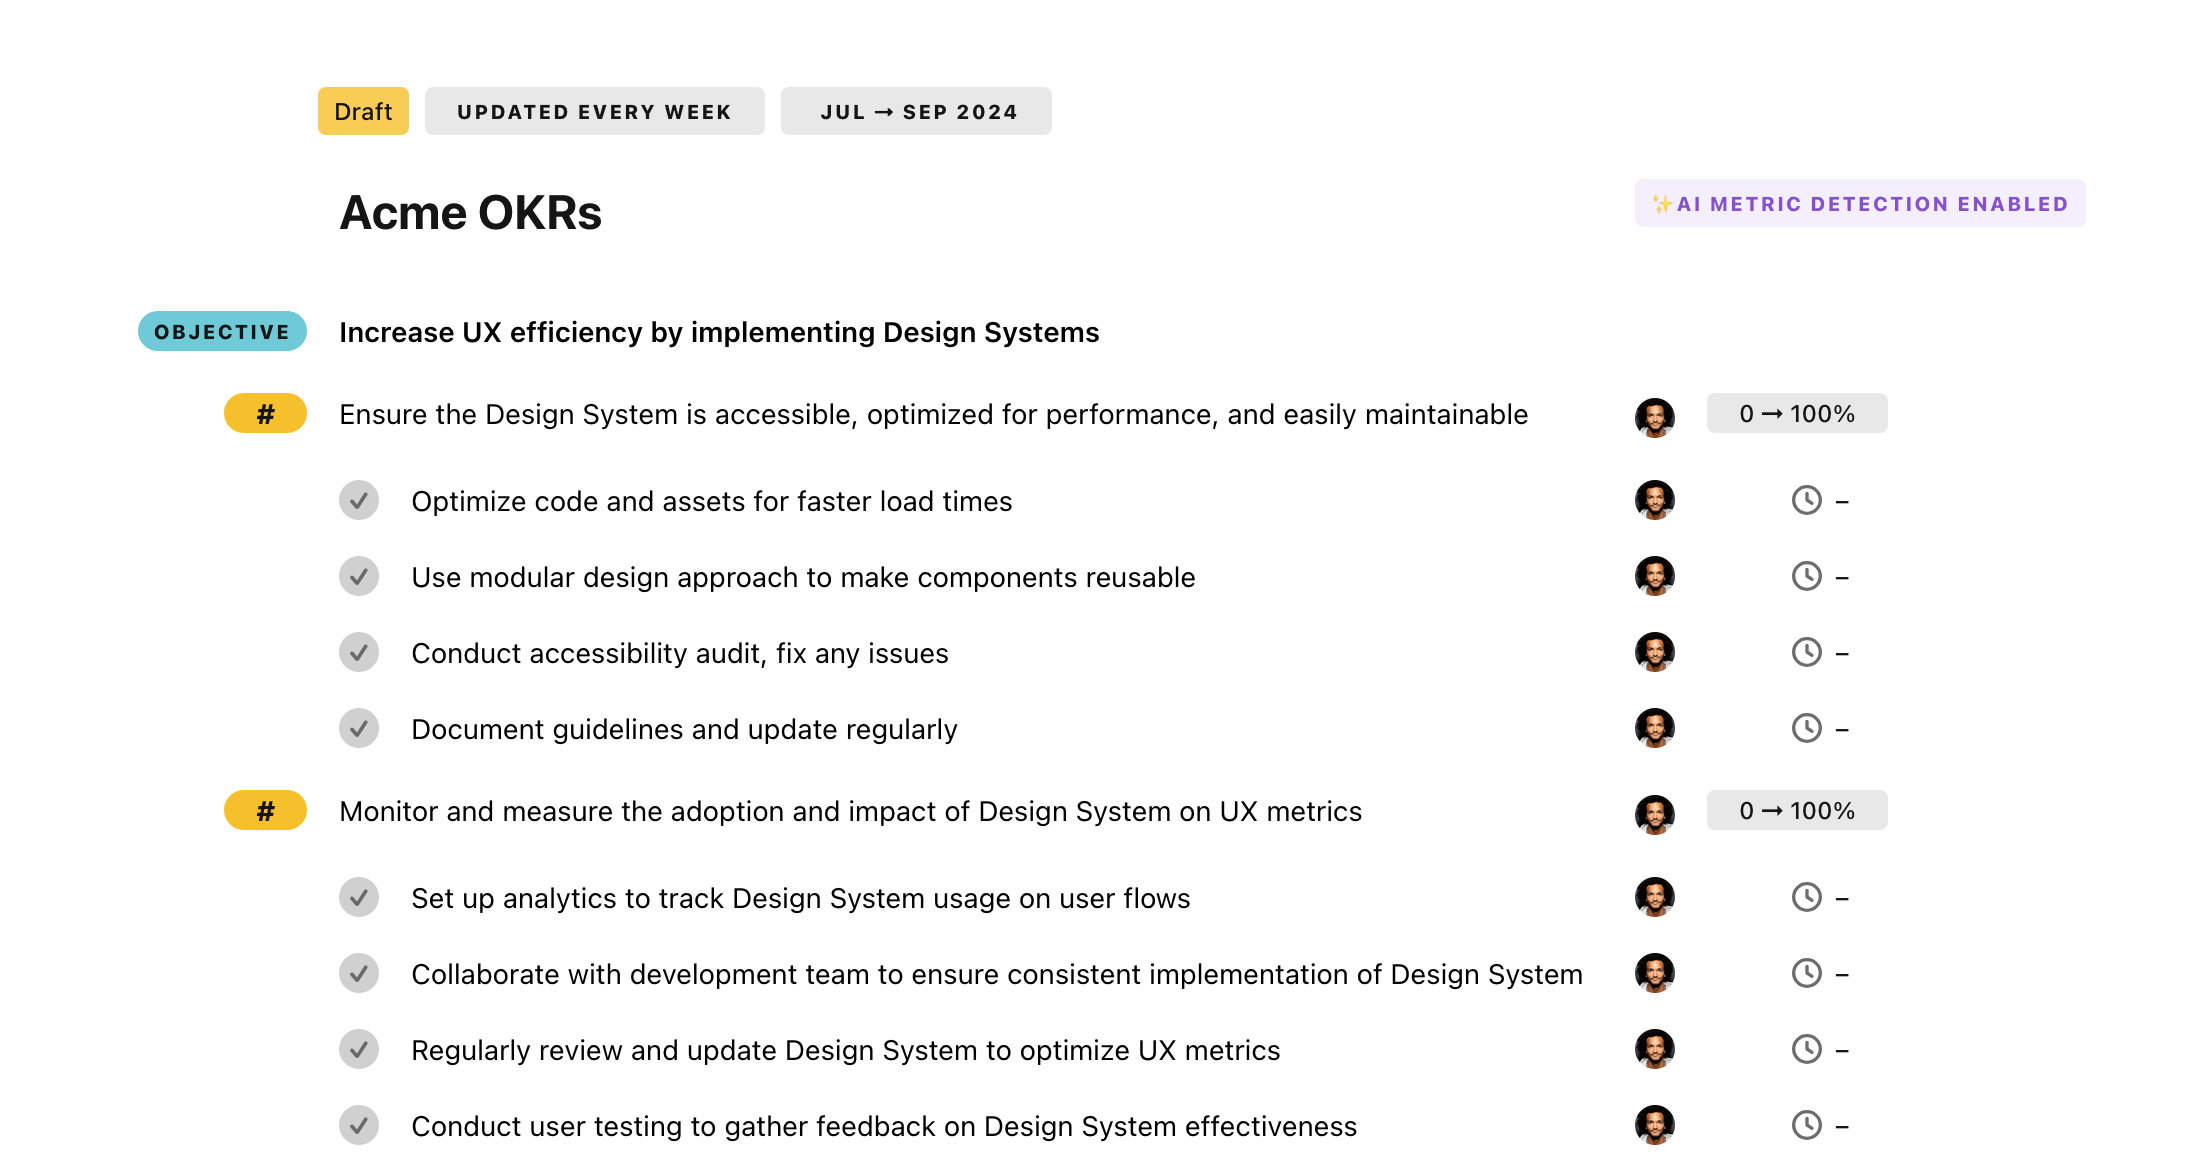
Once your example is in the plan editor, you will be able to:
- Edit the objectives, key results, and tasks
- Click on the target 0 → 100% to set better target
- Use the tips and the AI to refine your goals
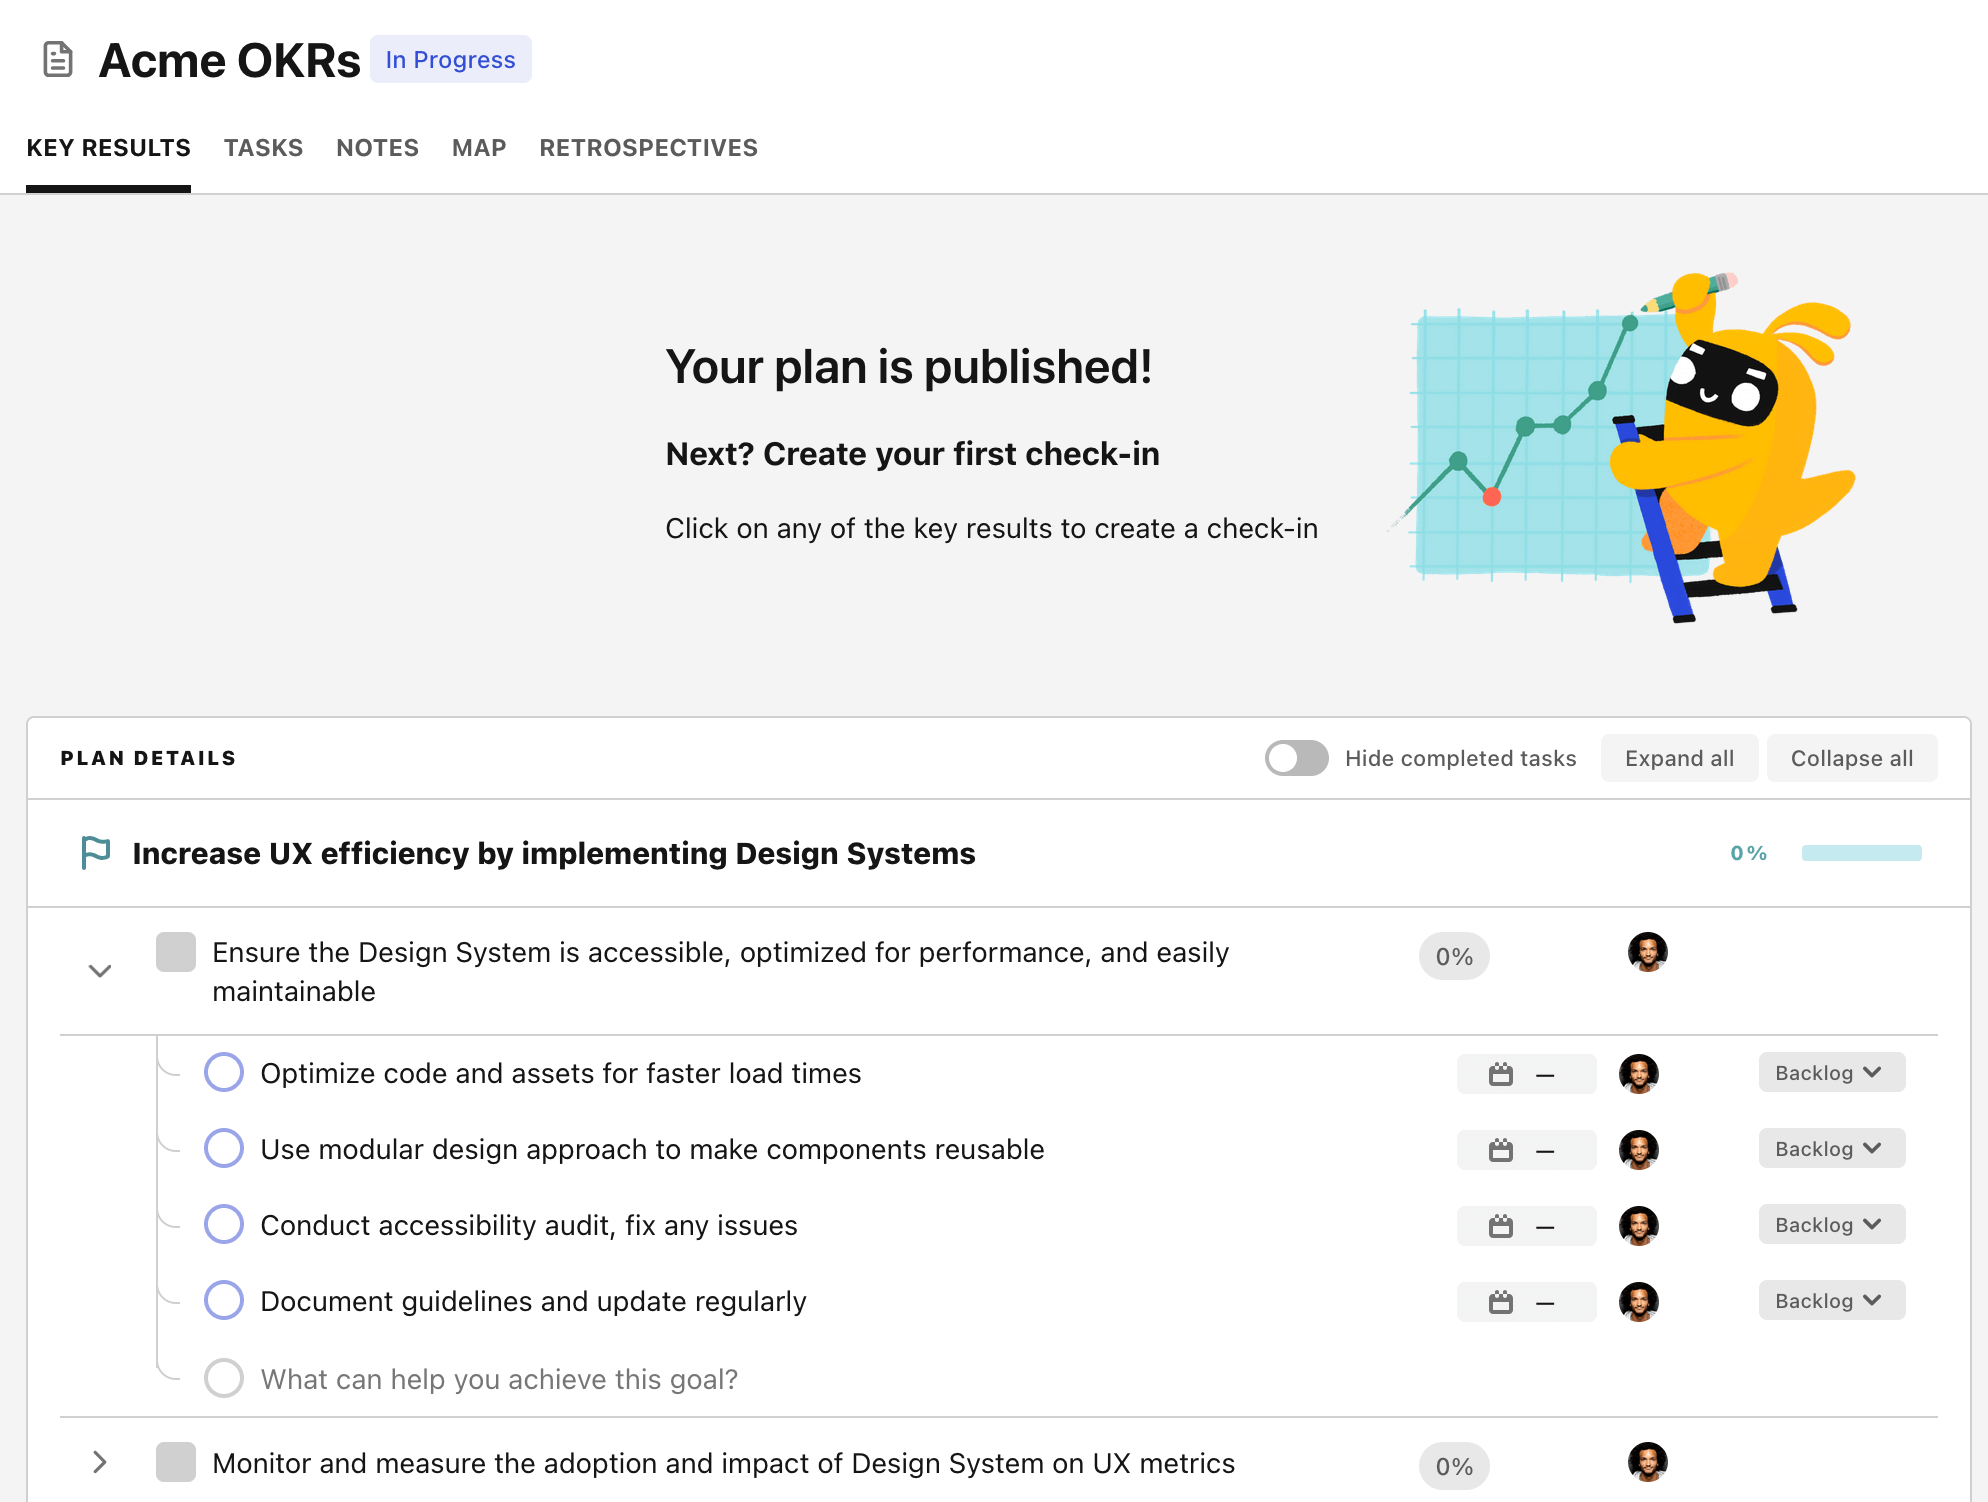
Step 4. Publish your plan
Once you’re done editing, you can publish your plan to switch to the goal-tracking mode.

From there you will have access to all the features that will help you and your team save hours with OKR reporting.
- 10+ built-in dashboards to visualise progress on your goals
- Weekly reminders, data connectors, and smart notifications
- 9 views to map OKRs to strategic projects
- Strategy map to align teams at scale